Candlewood Regulars and Long Island Sound Anglers Read Their Fish Finders Differently. What CT Freshwater and Saltwater Sonar Users Report About Structure, Arcs, and Electronics for Northeast Waters
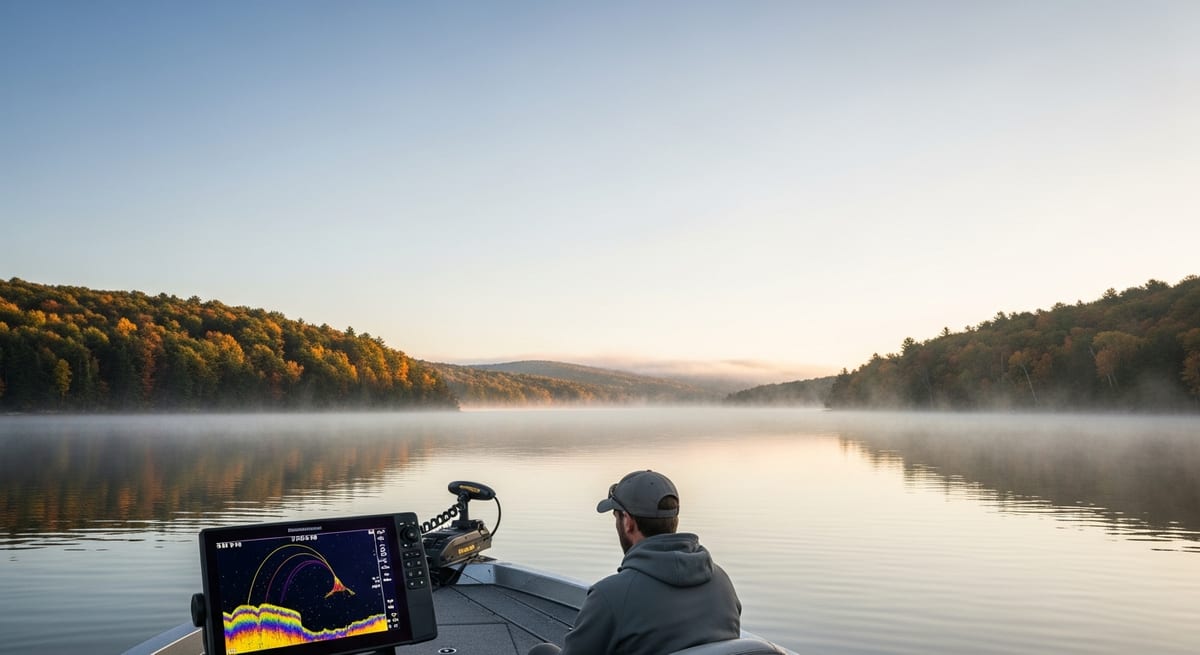
Candlewood Lake bass anglers who target the main lake ledges in midsummer often mark fish as thin partial arcs or loose clusters rather than the textbook rainbow arches that electronics tutorials show. Cone angle, vessel speed, and whether the fish is stationary all shape what shows on screen. Understanding those variables is the difference between marking fish and knowing you are marking fish. The Northeast adds another layer. Freshwater bass on Connecticut's thermal lakes read very differently from stripers over Long Island Sound mud bottom or fluke staging on a channel edge. Anglers working both environments report calibrating their sonar expectations by water type, not just by species.
How Sonar Actually Builds the Picture You See
Understanding the mechanics helps you read the display accurately.
The transducer: Sends a cone-shaped pulse of sound downward. Cone angle varies considerably: an 8-degree narrow beam covers a tight column useful for deep structure (Candlewood's 60-foot main basin, for example), while a 20-degree wide cone covers more area with less resolution. CHIRP units emit a range of frequencies simultaneously, producing a cleaner return than single-frequency units across a wider range of depths.
Echo return: Sound waves bounce off the bottom and any objects (fish, structure, weeds) and return to the transducer. Denser objects return stronger signals. Rock returns stronger than silt; a suspended fish returns differently than one resting on hard bottom.
Scrolling display: The screen scrolls right-to-left as time passes. The rightmost edge is the current reading. At idle trolling speeds, a feature that looks small on screen can represent 30 to 40 feet of horizontal bottom.
Depth: The bottom line equals depth. Most units scale automatically; in shallow back bays (common in CT lake coves that hold early-season largemouth), the display may compress dramatically.
Colors: Most modern units use color for signal strength. Red or orange indicates the strongest return (rock, hard bottom, dense fish). Yellow is moderate. Green or blue is softest (silt, scattered weeds, small fish). The color scale varies by brand and gain setting; what reads red on one unit may read yellow on another at default sensitivity.
Why Fish Arcs Don't Always Look Like the Textbook Version
Fish appear as arcs on traditional sonar, but arc fidelity depends on several variables that CT anglers learn to account for quickly.
Why arcs form: As the boat passes over a stationary fish, the fish enters the outer edge of the cone, crosses through the strongest center return, and exits the other edge. The scrolling display renders this entry-center-exit path as an arch shape.
The key caveat: A full arch assumes the boat passes directly over the fish, the fish holds still, and vessel speed is slow enough for the cone to register entry and exit cleanly. Anglers who run at higher scanning speeds often see compressed half-arcs or scattered blips rather than full arches. That doesn't mean fewer fish; it means the cone passed too quickly.
Cone angle matters: An 8-degree narrow beam requires much more precise boat positioning to produce full arcs than a 20-degree unit. CHIRP technology produces cleaner, more distinct arches at a wider range of speeds and depths. Candlewood bass anglers who fish vertical presentations in the 40 to 50-foot main basin often prefer CHIRP-capable units for that reason, based on gear discussion threads from CT bass clubs.
Partial arcs: Fish near the edge of the cone, or moving laterally, show partial arches or short line fragments. These are real fish marks; they just weren't in the center of the beam.
Arc thickness and depth position: Thicker arcs generally suggest larger fish or slower-moving targets that spent more time inside the cone. The vertical position of an arch on the screen indicates holding depth at the time of the return. Sonar converts echo return time to depth using a fixed speed-of-sound value; in very cold water (late-fall CT lakes below 45 degrees surface temperature), depth readings at extreme ranges may vary slightly from true depth.
Fish ID mode: Most units offer an auto-interpreted fish symbol overlay. The arc view provides more nuance: a fish symbol indicates a probable fish; the arc shape itself tells you how stationary it was, roughly how large, and how it relates to nearby structure.
CT Bottom Structure and What It Looks Like on Screen
The bottom line varies by substrate, and Connecticut waters give you the full range within a short drive.
Hard vs. soft bottom: A thick, high-contrast bottom line indicates hard substrate (rock ledge, gravel, packed sand). A thin, faded, or fuzzy return indicates soft bottom (silt, mud, decomposing vegetation). Candlewood anglers fishing the main basin encounter both: the eastern arm runs over rocky ledge drops that show bright, hard returns; the western shallows trend toward softer silt that shows as a faint, diffuse bottom signature.
On Long Island Sound: Anglers targeting summer flounder and sea bass over structured bottom report that LIS charts don't always match live sonar. Erosion, seasonal shell deposits, and debris create irregular returns not on any chart. Sonar-confirmed hard patches are worth a waypoint before anchoring or setting up a drift.
Depth transitions: Points, ledges, channel edges, and humps appear as the bottom line rising or dropping quickly on screen. The Housatonic River mouth below Derby has hard-bottom channel edges that show clearly on imaging modes; fluke anglers who scan before anchoring consistently report better drift results than those committing to GPS coordinates alone.
Double echo: On hard rock or dense gravel, some units produce a faint second bottom line below the primary return. This double echo is a reliable hard-bottom indicator, not a calibration error.
Weeds: Dense vegetation shows as a bright, irregular return that rises off the bottom line with a fuzzy top edge. Bass often suspend just above the top of the weed canopy; the sonar-visible weed height is a useful reference for setting lure depth.
Submerged timber: Individual logs or brush piles appear as isolated elevated returns above the bottom. The practical difference between wood, rock, and fish: a fish return moves or disappears on a return pass; structure returns are stable.
Down Imaging Shows What Traditional Sonar Can Only Suggest
Down imaging (terminology varies by manufacturer: DownScan, DI, and other proprietary names all describe similar technology) produces a near-photographic image of the bottom directly below the boat by using a high-frequency, very narrow beam.
What changes: Traditional sonar uses a cone-shaped beam and returns a simplified color chart. Down imaging compresses the beam to a thin slice, producing enough resolution to show individual rocks, laydowns, grass beds, stumps, and dock pilings as distinct shapes rather than blobs.
Frequency and depth: The specific frequency ranges used vary by unit and manufacturer; check your unit's spec sheet rather than relying on a universal figure. What holds across most units: higher-frequency, narrow-beam technology trades some depth penetration for resolution in the mid-range depths where most CT freshwater fishing occurs (under 60 feet in most Litchfield County lakes).
Fish in down imaging: Fish typically appear as thin horizontal lines or wisps rather than arches. They are harder to identify as fish at a glance but show their position relative to structure precisely. Seeing a fish-shaped wisp resting directly on a laydown is different information than an arch floating two feet above it.
Using both modes: CT bass anglers fishing Candlewood's mid-lake humps often run traditional sonar on one display while down imaging runs on a second. The traditional display identifies fish marks; the down imaging screen confirms what structure those fish are using. Anglers with single-unit setups typically run one pass on traditional sonar to count arcs, then a second pass on down imaging to map the structure underneath.
Saltwater use: Down imaging over LIS mud bottom produces less dramatic structure contrast than freshwater rock or timber, but remains useful for locating hard-bottom patches, shell hash, and mussel beds that hold structure-oriented species.
How CT Anglers Translate Sonar Into Fishing Decisions
Anglers on Candlewood who consistently locate fish in summer describe a two-pass process: one fast scan at higher speed to cover water and mark fish or structure, then a slower second pass to confirm and refine before setting up a presentation.
Work depth transitions first: When the bottom shows a rapid change (a ledge drop, a point edge, a channel margin), those transitions concentrate fish. Candlewood bass club reports from July and August consistently describe the main-basin ledge zone at roughly 35 to 45 feet as a summer largemouth and smallmouth holding area. Presentations dropped to the top edge of those ledges tend to outproduce flat mid-basin drifts, according to tournament field reports from CT Bass Nation affiliates.
Depth readings and water conditions: Sonar converts echo return time to depth using a standard speed-of-sound value. In saltwater environments like Long Island Sound, where salinity affects sound propagation, depth readings can vary slightly from true depth. For inshore LIS fishing at typical depths, the difference is minor; in very cold freshwater conditions (ice-off through early April on most CT lakes), add a small margin to extreme-range depth estimates.
Mark waypoints immediately: When fish arcs cluster or productive structure appears, mark the waypoint before drifting off it. CT bass club accounts consistently note that unmarked spots are almost never relocated to within casting distance on a return pass; the feature looks different from a different angle and the productive zone is easy to miss by 20 or 30 feet.
Scanning speed and arc quality: At higher speeds, the cone passes over fish faster, compressing arches and increasing the chance of missing a mark. Bass anglers targeting the deep Candlewood basin typically slow to trolling speed for scanning passes to get full arc information before committing to a jigging location.
Temperature sensors: If your unit includes a surface temperature sensor, watch for sharp breaks. On LIS in June and July, a 4 to 6-degree surface temperature differential across a short stretch of water often corresponds to a current line or upwelling. Shore casters who work the central Sound report that weakfish, bluefish, and juvenile stripers commonly stack on the warmer side of those breaks.
EVERY SATURDAY MORNING
Weekly fishing intelligence
Nationwide conditions, what's biting, and honest gear deals. One email, no noise.
No spam. Unsubscribe anytime.